The world of Search Engine Optimization (SEO) has evolved dramatically in recent years, compared to the black box it once was a decade ago. One of the hotter topics broadcasted from Google is about a set of metrics reflecting “page experience” referred to as Web Vitals, which now play a part in search ranking. One way to gather insight into factors that encompass Web Vitals metrics is to utilize Google’s Lighthouse tool.
What is Lighthouse?

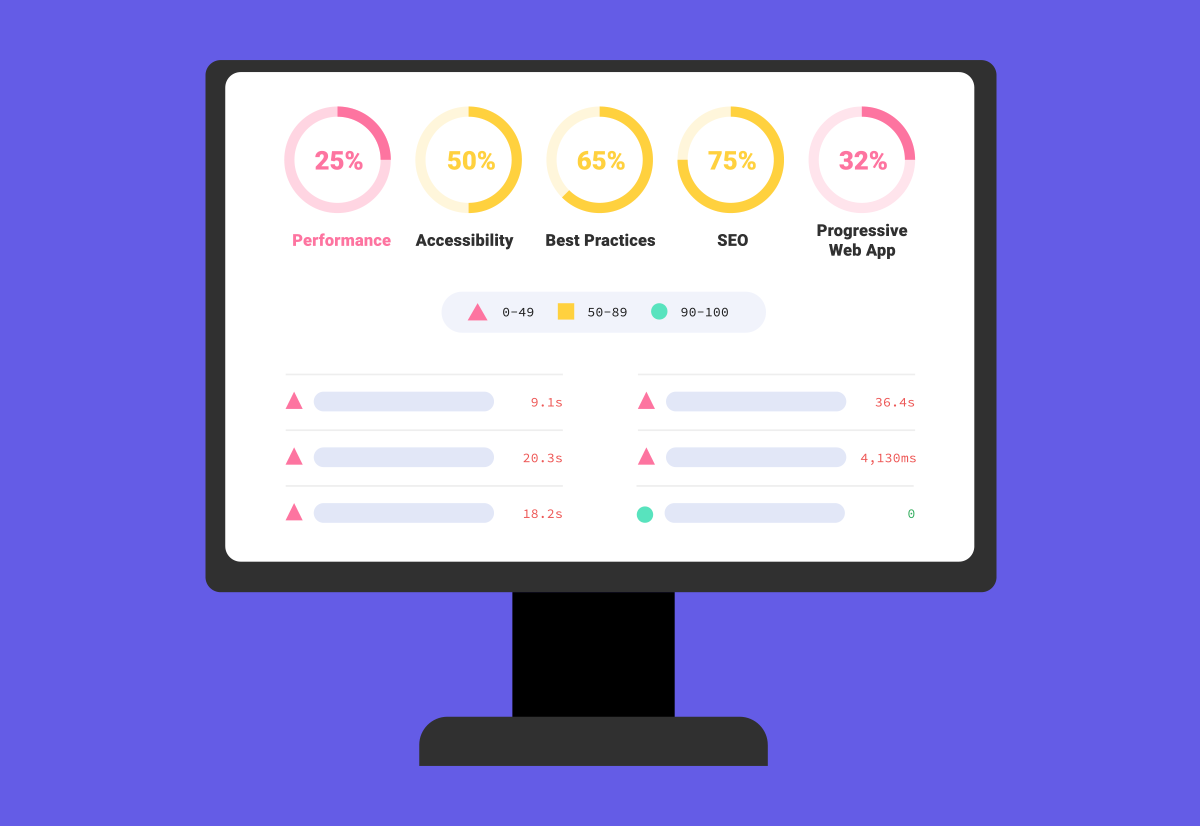
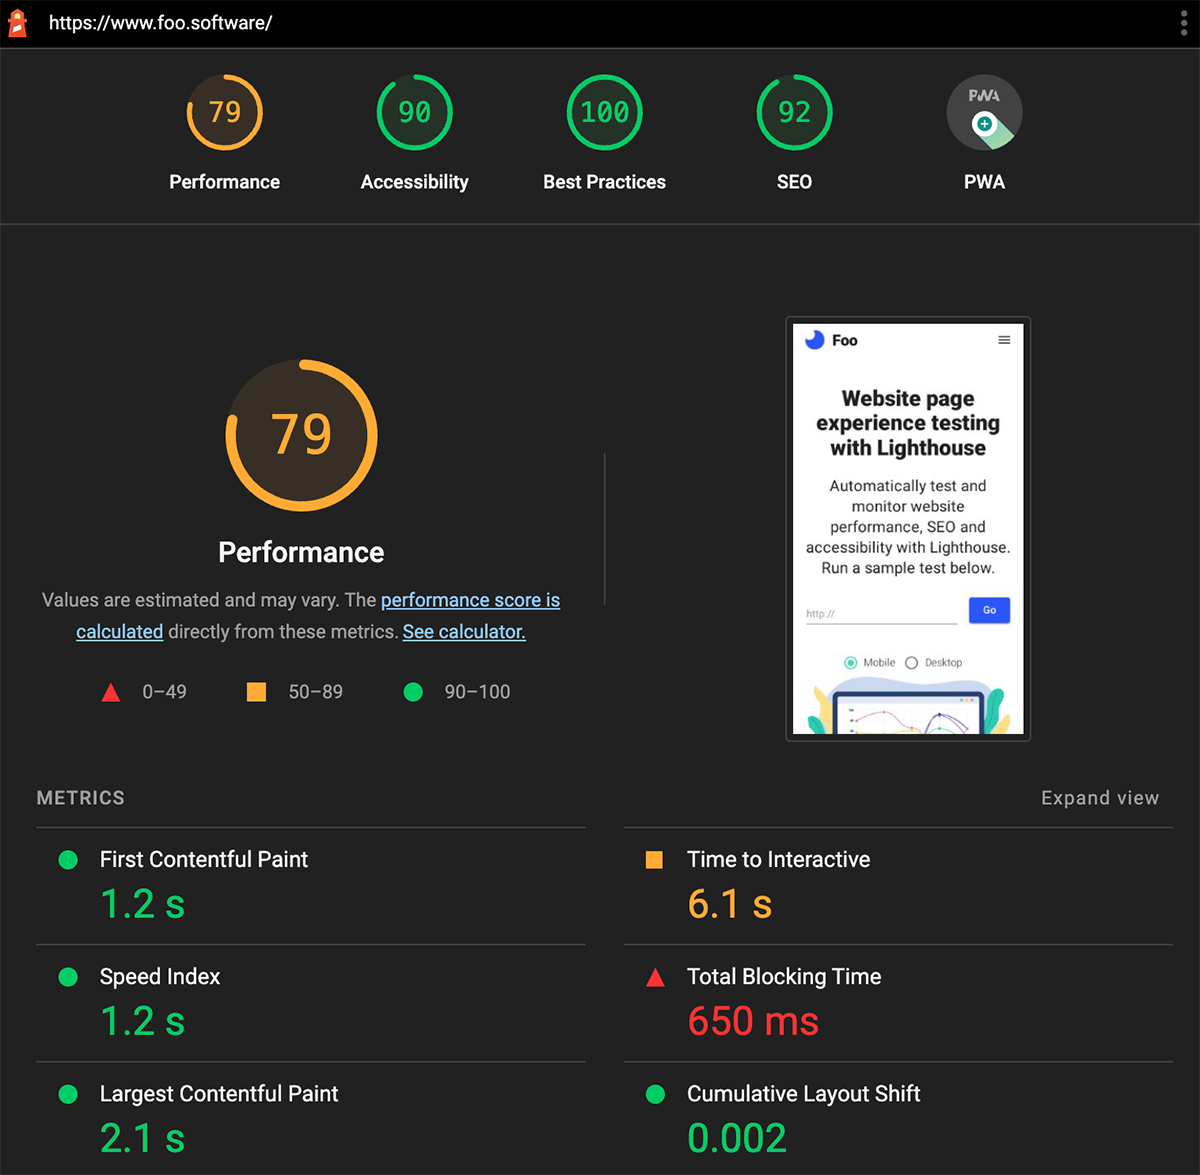
Google Lighthouse is an open-source, automated tool that collects and utilizes lab data to measure web page quality. It determines quality based on a set of metrics and categories of metrics that can be thought of as a reflection of “page experience”. Lab data from Lighthouse mirrors Web Vitals and in fact include certain Web Vitals metrics.
How to Use Lighthouse
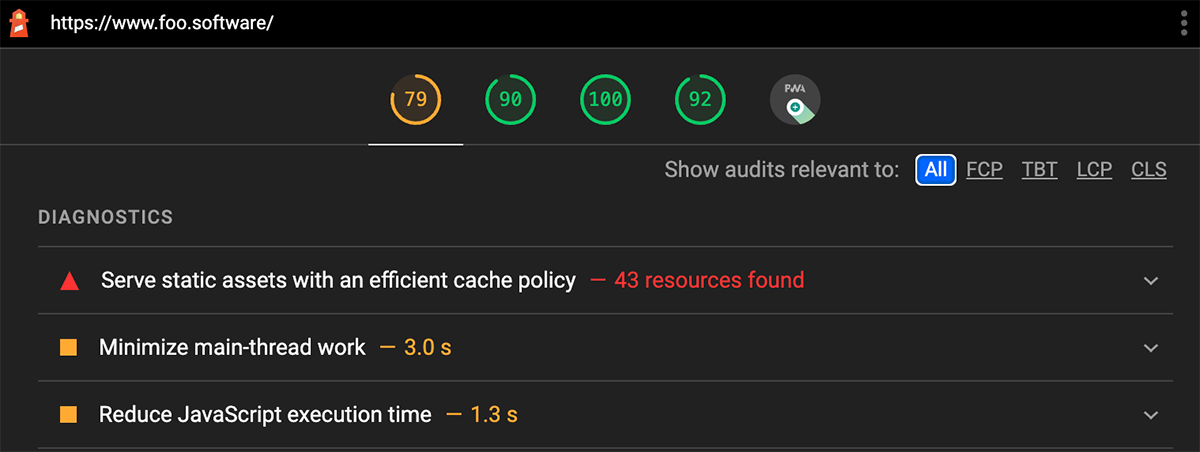
There are several ways one can run Lighthouse – the most commonly known being directly from the browser in Google Chrome’s DevTools. Upon running Lighthouse, you specify the URL and type of device (desktop or mobile) to run against. When Lighthouse completes, it provides a report with audit scores and detailed diagnostics on how to improve.


You can run Lighthouse manually, from Chrome DevTools for example, or in an automated fashion. Below are the available ways to run Lighthouse.
- Lighthouse Chrome DevTools
- Lighthouse Chrome Extension
- Programmatically running Lighthouse with Node.js
- Automatically running Lighthouse with a service like foo.software
How to Monitor Page Experience with Lighthouse and Foo

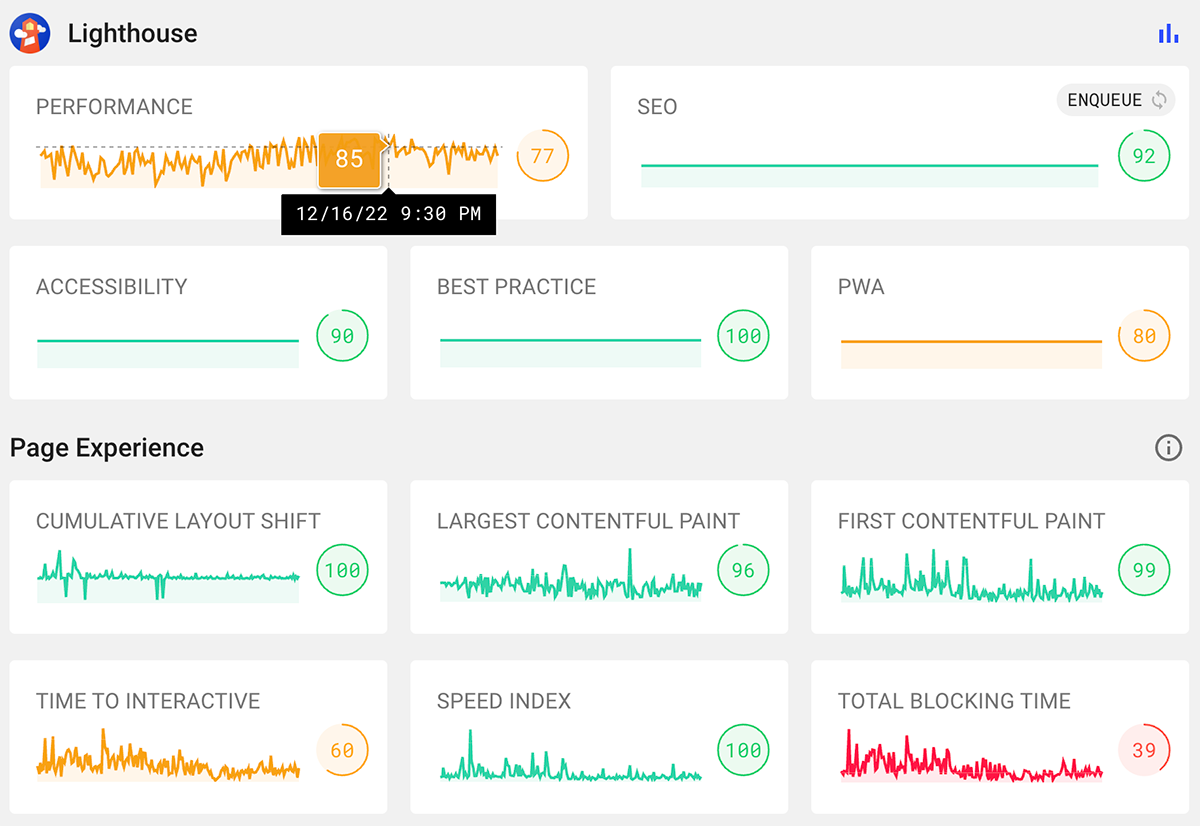
Out-of-the box Lighthouse can only run manually, but with a bit of crafting and resourcefulness, you can run Lighthouse automatically! Foo is a service that provides a way of monitoring website quality by automating Lighthouse and watching for change in results.
Check out this post for more details about setting up Foo to monitor page experience with Lighthouse.
0 Commentaires